









Check this out...

Thread Starter
|
Senior User
Joined: Jan 2004
Posts: 152
Likes: 0
From: Tamarac Fl
In other words, each bar represents a 5 minute average.
Posting Guru
Joined: Dec 2007
Posts: 1,449
Likes: 5
From: Fort Pierce, Fl
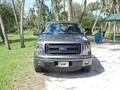
I am not sure on the time scale will read the book and see, but I can tell you, you do not have to be going down hill to achieve this. I have taken many rides along the Indian river from Ft Pierce to Stewart Fl. approx miles 20 and speeds from 35 - 45 mph and can hold 30 on the meter for a long time. Last trip when I arrived in Stewart I was at 28 mpg, which then slowly started to decline riding around town. My wife snaped this pic about 5 miles out from Stewart, hit 28 as we pulled into town. Started the ride out with a full tank and the meter reset. This entire ride is on flat roads, no hills up or down.

Posting Guru
Joined: Dec 2007
Posts: 1,449
Likes: 5
From: Fort Pierce, Fl
Fuel Hist.: Press the right arrow key (when in the Fuel Econ. menu) to
reach Fuel Hist. Fuel history shows fuel usage (AVG MPG or L/100km)
as a bar graph based on time. The duration time can be changed as
follows:
Duration– Press the right arrow key (when in the Fuel Hist. menu) to
reach the following duration choices.
• 5 Minutes
• 10 Minutes
• 30 Minutes
• Last 5 Resets
Use the up/down arrows keys to highlight one of the choices; press and
hold OK to set your choice.
The graph is updated each minute with the fuel economy that was
achieved during the prior 5, 10, 30 minutes or last 5 resets of driving.
So I think this means if set on 5 min it will update every min giving you the last 5 min window, so if there are 5 bars each bar would represent 1 min. Or am I just confused again?
reach Fuel Hist. Fuel history shows fuel usage (AVG MPG or L/100km)
as a bar graph based on time. The duration time can be changed as
follows:
Duration– Press the right arrow key (when in the Fuel Hist. menu) to
reach the following duration choices.
• 5 Minutes
• 10 Minutes
• 30 Minutes
• Last 5 Resets
Use the up/down arrows keys to highlight one of the choices; press and
hold OK to set your choice.
The graph is updated each minute with the fuel economy that was
achieved during the prior 5, 10, 30 minutes or last 5 resets of driving.
So I think this means if set on 5 min it will update every min giving you the last 5 min window, so if there are 5 bars each bar would represent 1 min. Or am I just confused again?
Thread Starter
|
Senior User
Joined: Jan 2004
Posts: 152
Likes: 0
From: Tamarac Fl
Now I'm confused
 .
.
Posting Guru
Joined: Dec 2007
Posts: 1,449
Likes: 5
From: Fort Pierce, Fl
FTE Stories
Ford Trucks for Ford Truck Enthusiasts

Top 10 Most Expensive Ford Trucks Ever Sold on Bring a Trailer
Joe Kucinski
2027 Ford Super Duty Buyer's Guide (Every Model, Engine, & Package)
Brett Foote
Top 10 Ford Truck Tragedies
Joe Kucinski
AEV FXL Super Duty - the Super Duty Raptor Ford Doesn't Make
Brett Foote
Lobo Vs Lobo: Proof the F-150 Lobo Should Be Even Lower!
Michael S. Palmer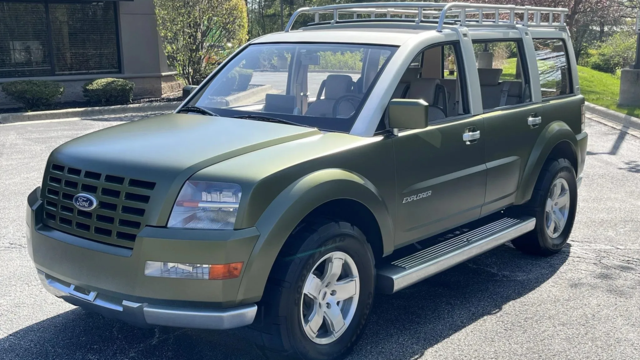
Ford's 2001 Explorer Sportsman Concept Looks For a New Home
Verdad Gallardo
10 Best Ford Truck Engines We Miss the Most!
Joe Kucinski
2026 Shelby F-150 Off-Road: Better Than a Raptor R?
Brett Foote
2027 Super Duty Carhartt Package First Look: 12 Things You NEED to Know!
Michael S. Palmer
Thread
Thread Starter
Forum
Replies
Last Post
72Truckin
1967 - 1972 F-100 & Larger F-Series Trucks
4
Dec 1, 2012 05:03 PM
KiwiFord
1948 - 1956 F1, F100 & Larger F-Series Trucks
60
Sep 6, 2011 02:38 AM
Plums72
1980 - 1986 Bullnose F100, F150 & Larger F-Series Trucks
21
Jul 14, 2009 10:47 AM
