
Life Expectancy Curves... Human vs Stock 7.3L
#1
 01-19-2010, 01:00 PM


Join Date: Jun 2006
Location: Fulltime RVer
Posts: 2,647
Likes: 0
Received 0 Likes
on
0 Posts
#2
01-19-2010, 01:02 PM
Join Date: Jun 2006
Location: Fulltime RVer
Posts: 2,647
Likes: 0
Received 0 Likes
on
0 Posts
Life Expectancy Curves... Human vs Stock 7.3L
I'm sure some members will think that reading about the probability of human death in general ...and about the probability of one's own death in particular ...and about the probability of one's beloved 7.3L Power Stroke engine dying ...aren't the most pleasant of topics to be considering ...but as it turns out these topics sure are interesting ones for me to analyze!
It all started a few weeks ago when I received some information about the 50th year high school reunion being planned for my "class of 1960" and I was shocked to learn that 72 classmates from my 560 member graduating class have died! So of course I immediately started doing some analysis and these 72 deaths works out to be a... {(72)/(560)}(100)=13% death rate averaged over the 50-year period since graduation!
So assuming my classmates are a "representative sample" of the US population how does this 13% "measured" death rate compare to the "expected" death rate of the US population at large? Well I used data from this reference... United States Life Tables... http://www.cdc.gov/nchs/data/nvsr/nvsr53/nvsr53_06.pdf ...and using the graphs that I generated from this data which I'll discuss later ...the "expected" death rate in the US population at large for the 50-years following age 18 is an even larger 21% ...so in the "game of life" which is by and large just a "game of chance" anyway the 13% death rate for my classmates and I means that we're doing much better than members of the US population at large!
Well a 13% death rate over a 50-year period averages out to be a... {(13)/(50)}=0.26% probability of dying each year ...so does this mean I've only got a 0.26% probability of dying next year? Well I wish that were true but as all "oldsters" inherently know we've got a significantly higher probability of dying each year than "youngsters" do ...and using the average death rate for classmates who died between the ages of 18 to 68 to calculate my probability of dying next year drastically underestimates the correct answer ...so I pressed on with my analysis!
Well it turns out that I've got an almost 8 times higher 2% probability of dying next year... ouch! ...and that realization started me thinking about how to calculate the probability of my C7 dying before the next year rolls around! Well Caterpillar claims that based on laboratory tests and engine disassembly analysis a C7 should have a 50% probability of living for 300K to 500K miles depending on its FWHP rating and on the type of service it's subjected to.
If one assumes the above means the life expectancy "curve" for a C7 is a "straight-line" which decreases from 100% alive at 0 miles to 50% alive at say 350K miles then there's a... {(50)/(350)}=0.143% average probably of a C7 dying for each 1K miles that it's driven ...so if I drive my typical 14K miles next year my C7 has a... {(14)(0.143)}=2% probability of dying ...ouch!
So I've got a 2% probability of dying next year and my C7 has a 2% probability of dying next year... double ouch! Well there's no way that I can rationalize the 2% probability of me dying next year as being in error ...and believe me I've tried ...but since humans in a younger "age group" clearly have a lower death rate than those in an older "age group" maybe the same thing holds true for diesel engines as well so that engines in a lower "mileage group" will also have a lower death rate than those in a higher "mileage group"!
Unlike my "high-mileage" body my C7 only has 27K miles on its odometer ...and as it turns out this means my C7 is literally just a child with an equivalent human age of only 9 years old ...and there's only a 0.1% probability of my C7 dying before reaching the equivalent human age of 15 years old at which time it will have 50K miles on its odometer! It's interesting to note that when my C7 was just a "newborn" baby with 0 miles on its odometer there was an 8 times higher 0.8% probability of it dying before reaching the equivalent human age of 5 years old at which time it would've had 17K miles on its odometer!
So the "smart money" would wager on the side of me dying before my C7 does ...but for some reason even though I love my big truck I take little comfort in this realization ...especially when my wife says that finding a buyer for that "oversized ugly truck" will be her first priority when I die! Well at least I've already picked out my "epitaph" ...So I'll Go No More a-Roving ...which of course is just a blatant rip-off from the poem by Lord Byron ...So We'll Go No More a-Roving ...and maybe I can convince my wife to just put that on a common head stone and be done with it!
Now down to the "life and death" business of a 7.3L Power Stroke! The International T444E which is similar to the Ford 7.3L Power Stroke claims a B10 life of 200K miles and a B50 life of 350K miles ...and I assume these numbers mean that "statistically" 90% of these engines will still be alive and running fairly well at 200K miles and that 10% will have either died or have required major work or a rebuild by 200K miles ...and likewise that 50% of these engines will still be alive at 350K miles and running fairly well and that 50% will have either died or have required major work or a rebuild by 350K miles.
Well having International give both a B10 and a B50 "life expectancy" for a T444E sheds some light on the likely "shape" of the life expectancy curve for a 7.3L Power Stroke and these B10 and a B50 mileages clearly show that an engine's life expectancy curve isn't a straight-line decreasing from 100% alive at 0 miles to 50% alive at the mileage quoted for its B50 life! My first "graphical effort" to illustrate this point was to overlay the B10 and a B50 mileages on the graph below which I copied from the reference I gave earlier.
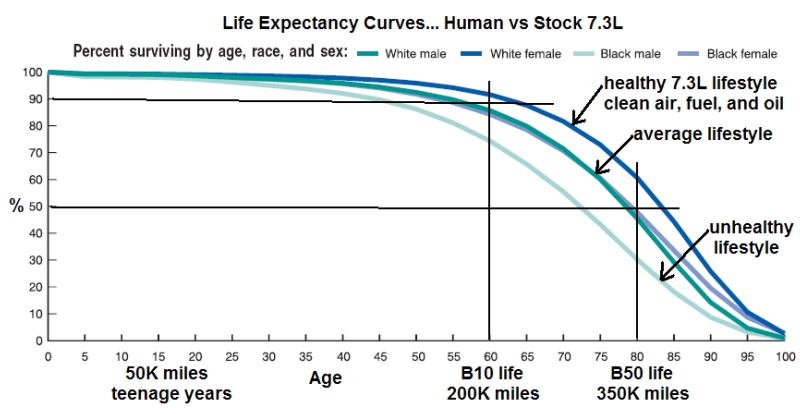
Before proceeding I want to make sure that no one misinterprets my use of "gender and race" based "life expectancy" curves to analyze the "life expectancy" of a 7.3L Power Stroke as having overtones of "sexism" or "racism" because these are just the way that "life expectancy" curves are reported in the literature ...but I'm confident that "congress" will soon change this by passing a new "politically correct" law requiring all "genders and races" to have exactly the same "life expectancy" ...and in fact the IRS has already done that by replacing their previous "gender based" life expectancy tables used for calculating the minimum required IRA withdrawal with a "unisex" life expectancy table where one size fits all!
As can be seen in the in the above graphs I labeled one of the "human curves" the "healthy 7.3L lifestyle" and I labeled the two "human curves" which basically form a "median curve" the "average 7.3L lifestyle" and I labeled the remaining "human curve" the "unhealthy 7.3L lifestyle"! In my view a "7.3L lifestyle" includes maintenance procedures and the type of service the engine is subjected to ...severe duty service such as constant towing ...moderate duty service such as occasional towing ...and light duty service such as hauling an occasional load in the bed! The "drive it like you stole it" lifestyle is equivalent to the human lifestyle of "burning the candle at both ends" and neither of these lifestyles are conducive to enhanced longevity!
One can also associate an "equivalent human age" with the "mileage age" of a 7.3L Power Stroke ...and associating the 200K B10 mileage with an "equivalent human age" of 60 years old and the 350K B50 mileage with an "equivalent human age" of 80 years old lines up with the "average 7.3L lifestyle" curve fairly well ...so I used the life expectancy data for the average US population as a whole to generate the curves in the graph below where I also "extrapolated" the results out to an "equivalent human age" of 95 with a B90 mileage of 440K miles where only 10% of the engines will still be alive and running fairly well and 90% will have either died or have required major work or a rebuild.
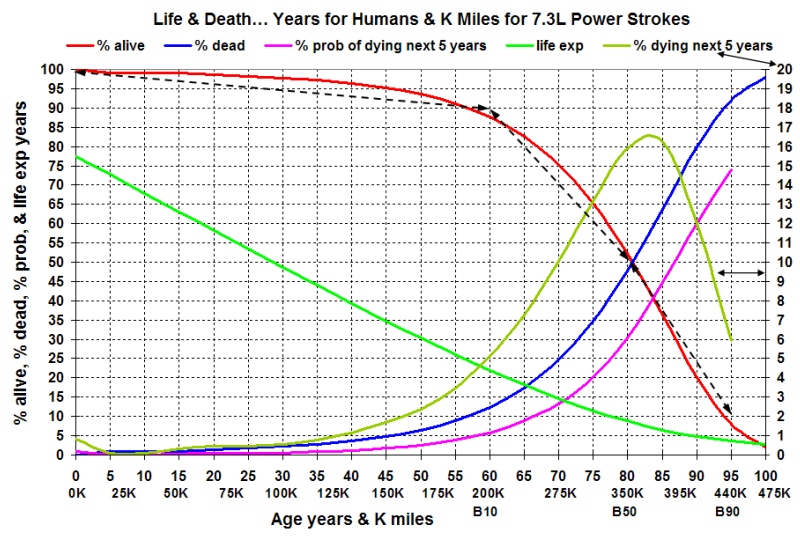
As can be seen in the above graph the dotted black double arrow headed lines connecting the 0 mile to B10 to B50 to B90 mileages line up so well with the red curve for the % of humans that are still living at a given age that one is compelled to conclude that since the shape of the human curve is determined by wear and tear "aging mechanisms" unique to humans there must also be some corresponding wear and tear "aging mechanisms" unique to diesels that are responsible for the essentially identical shape of the curve for the % of diesels that are still living at a given mileage ...and I'll discuss why I think these curves have the unique shapes that they do in my next installment!
But for now I'll just describe how to read these curves. Except for the lime green curve which is read on the right hand scale ...all of the other curves are read on the left hand scale. The red curve is the % of humans that are alive at a given age or the % of engines that are alive at a given mileage ...and the blue curve is the % of humans that are dead at a given age or the % of engines that are dead at a given mileage.
The pink curve is the % probability of a human dying in the next 5 years or the % probability of a an engine dying in the next 5 years worth of age-equivalent mileage. For example at age 95 years old there's a 74% probability of a human dying in the next 5 years before reaching an age of 100 years old and at age 440K miles there's a 74% probability of an engine dying in the next 35K miles before reaching a mileage of 475K miles! On the other hand a 60 year old human has a 6% probability of dying prior to reaching 65 years of age...and a 200K mile engine has a 6% probability of dying prior to reaching 238K miles!
For a human that's lived to a given age the bright green curve gives the remaining years of life expectancy. For example if a human lives to age 50 look straight up from age 50 to the bright green curve and then across to the left hand scale to see 30 years of remaining life expectancy ...which means there's a 50% probability that a 50 year old human will live an additional 30 years to an age of 80 years!
If I make it a few more years to age 70 then I've got 15 years of remaining life expectancy ...which means there'll be a 50% probability that I'll make it to age 85 ...but first I've got to make it to age 70! The "only" advantage of being older is that you've got a higher probability of making it to an even older age than a younger person has!
If an engine makes it to an "equivalent human age" of 70 years old which corresponds to 275K miles old then the engine has 15 years of remaining human equivalent life expectancy which corresponds to 105K additional miles for a total of 380K miles at an "equivalent human age" of 85 ...of course there's only a 50% probability that the engine will actually make it to 380K miles!
This leaves the lime green curve which is read on the right hand scale ...and this curve explains why people start paying closer attention to the obituaries at the age of 70 ...because 10% of their contemporaries die between the ages of 70 to 75 ...and another 13% die between the ages of 75 to 80 ...and another 16% die between the ages of 80 to 85 ...and yet another 16% die between the ages of 85 to 90 ...and then only an additional 12% die between the ages of 90 to 95 ...and this reduces to only an additional 6% dying between the ages of 95 to 100 ...because if you're still alive to read the obituaries at the age of 95 you're in a select group of only 8% remaining to do so ...and that means there just aren't very many people left to die!
If there were an obituary column for 7.3L Power Stroke engines it would read just like the above example for humans except the age at death would be the equivalent mileage shown on the graph!
It all started a few weeks ago when I received some information about the 50th year high school reunion being planned for my "class of 1960" and I was shocked to learn that 72 classmates from my 560 member graduating class have died! So of course I immediately started doing some analysis and these 72 deaths works out to be a... {(72)/(560)}(100)=13% death rate averaged over the 50-year period since graduation!
So assuming my classmates are a "representative sample" of the US population how does this 13% "measured" death rate compare to the "expected" death rate of the US population at large? Well I used data from this reference... United States Life Tables... http://www.cdc.gov/nchs/data/nvsr/nvsr53/nvsr53_06.pdf ...and using the graphs that I generated from this data which I'll discuss later ...the "expected" death rate in the US population at large for the 50-years following age 18 is an even larger 21% ...so in the "game of life" which is by and large just a "game of chance" anyway the 13% death rate for my classmates and I means that we're doing much better than members of the US population at large!
Well a 13% death rate over a 50-year period averages out to be a... {(13)/(50)}=0.26% probability of dying each year ...so does this mean I've only got a 0.26% probability of dying next year? Well I wish that were true but as all "oldsters" inherently know we've got a significantly higher probability of dying each year than "youngsters" do ...and using the average death rate for classmates who died between the ages of 18 to 68 to calculate my probability of dying next year drastically underestimates the correct answer ...so I pressed on with my analysis!
Well it turns out that I've got an almost 8 times higher 2% probability of dying next year... ouch! ...and that realization started me thinking about how to calculate the probability of my C7 dying before the next year rolls around! Well Caterpillar claims that based on laboratory tests and engine disassembly analysis a C7 should have a 50% probability of living for 300K to 500K miles depending on its FWHP rating and on the type of service it's subjected to.
If one assumes the above means the life expectancy "curve" for a C7 is a "straight-line" which decreases from 100% alive at 0 miles to 50% alive at say 350K miles then there's a... {(50)/(350)}=0.143% average probably of a C7 dying for each 1K miles that it's driven ...so if I drive my typical 14K miles next year my C7 has a... {(14)(0.143)}=2% probability of dying ...ouch!
So I've got a 2% probability of dying next year and my C7 has a 2% probability of dying next year... double ouch! Well there's no way that I can rationalize the 2% probability of me dying next year as being in error ...and believe me I've tried ...but since humans in a younger "age group" clearly have a lower death rate than those in an older "age group" maybe the same thing holds true for diesel engines as well so that engines in a lower "mileage group" will also have a lower death rate than those in a higher "mileage group"!
Unlike my "high-mileage" body my C7 only has 27K miles on its odometer ...and as it turns out this means my C7 is literally just a child with an equivalent human age of only 9 years old ...and there's only a 0.1% probability of my C7 dying before reaching the equivalent human age of 15 years old at which time it will have 50K miles on its odometer! It's interesting to note that when my C7 was just a "newborn" baby with 0 miles on its odometer there was an 8 times higher 0.8% probability of it dying before reaching the equivalent human age of 5 years old at which time it would've had 17K miles on its odometer!
So the "smart money" would wager on the side of me dying before my C7 does ...but for some reason even though I love my big truck I take little comfort in this realization ...especially when my wife says that finding a buyer for that "oversized ugly truck" will be her first priority when I die! Well at least I've already picked out my "epitaph" ...So I'll Go No More a-Roving ...which of course is just a blatant rip-off from the poem by Lord Byron ...So We'll Go No More a-Roving ...and maybe I can convince my wife to just put that on a common head stone and be done with it!
Now down to the "life and death" business of a 7.3L Power Stroke! The International T444E which is similar to the Ford 7.3L Power Stroke claims a B10 life of 200K miles and a B50 life of 350K miles ...and I assume these numbers mean that "statistically" 90% of these engines will still be alive and running fairly well at 200K miles and that 10% will have either died or have required major work or a rebuild by 200K miles ...and likewise that 50% of these engines will still be alive at 350K miles and running fairly well and that 50% will have either died or have required major work or a rebuild by 350K miles.
Well having International give both a B10 and a B50 "life expectancy" for a T444E sheds some light on the likely "shape" of the life expectancy curve for a 7.3L Power Stroke and these B10 and a B50 mileages clearly show that an engine's life expectancy curve isn't a straight-line decreasing from 100% alive at 0 miles to 50% alive at the mileage quoted for its B50 life! My first "graphical effort" to illustrate this point was to overlay the B10 and a B50 mileages on the graph below which I copied from the reference I gave earlier.
Before proceeding I want to make sure that no one misinterprets my use of "gender and race" based "life expectancy" curves to analyze the "life expectancy" of a 7.3L Power Stroke as having overtones of "sexism" or "racism" because these are just the way that "life expectancy" curves are reported in the literature ...but I'm confident that "congress" will soon change this by passing a new "politically correct" law requiring all "genders and races" to have exactly the same "life expectancy" ...and in fact the IRS has already done that by replacing their previous "gender based" life expectancy tables used for calculating the minimum required IRA withdrawal with a "unisex" life expectancy table where one size fits all!
As can be seen in the in the above graphs I labeled one of the "human curves" the "healthy 7.3L lifestyle" and I labeled the two "human curves" which basically form a "median curve" the "average 7.3L lifestyle" and I labeled the remaining "human curve" the "unhealthy 7.3L lifestyle"! In my view a "7.3L lifestyle" includes maintenance procedures and the type of service the engine is subjected to ...severe duty service such as constant towing ...moderate duty service such as occasional towing ...and light duty service such as hauling an occasional load in the bed! The "drive it like you stole it" lifestyle is equivalent to the human lifestyle of "burning the candle at both ends" and neither of these lifestyles are conducive to enhanced longevity!
One can also associate an "equivalent human age" with the "mileage age" of a 7.3L Power Stroke ...and associating the 200K B10 mileage with an "equivalent human age" of 60 years old and the 350K B50 mileage with an "equivalent human age" of 80 years old lines up with the "average 7.3L lifestyle" curve fairly well ...so I used the life expectancy data for the average US population as a whole to generate the curves in the graph below where I also "extrapolated" the results out to an "equivalent human age" of 95 with a B90 mileage of 440K miles where only 10% of the engines will still be alive and running fairly well and 90% will have either died or have required major work or a rebuild.
As can be seen in the above graph the dotted black double arrow headed lines connecting the 0 mile to B10 to B50 to B90 mileages line up so well with the red curve for the % of humans that are still living at a given age that one is compelled to conclude that since the shape of the human curve is determined by wear and tear "aging mechanisms" unique to humans there must also be some corresponding wear and tear "aging mechanisms" unique to diesels that are responsible for the essentially identical shape of the curve for the % of diesels that are still living at a given mileage ...and I'll discuss why I think these curves have the unique shapes that they do in my next installment!
But for now I'll just describe how to read these curves. Except for the lime green curve which is read on the right hand scale ...all of the other curves are read on the left hand scale. The red curve is the % of humans that are alive at a given age or the % of engines that are alive at a given mileage ...and the blue curve is the % of humans that are dead at a given age or the % of engines that are dead at a given mileage.
The pink curve is the % probability of a human dying in the next 5 years or the % probability of a an engine dying in the next 5 years worth of age-equivalent mileage. For example at age 95 years old there's a 74% probability of a human dying in the next 5 years before reaching an age of 100 years old and at age 440K miles there's a 74% probability of an engine dying in the next 35K miles before reaching a mileage of 475K miles! On the other hand a 60 year old human has a 6% probability of dying prior to reaching 65 years of age...and a 200K mile engine has a 6% probability of dying prior to reaching 238K miles!
For a human that's lived to a given age the bright green curve gives the remaining years of life expectancy. For example if a human lives to age 50 look straight up from age 50 to the bright green curve and then across to the left hand scale to see 30 years of remaining life expectancy ...which means there's a 50% probability that a 50 year old human will live an additional 30 years to an age of 80 years!
If I make it a few more years to age 70 then I've got 15 years of remaining life expectancy ...which means there'll be a 50% probability that I'll make it to age 85 ...but first I've got to make it to age 70! The "only" advantage of being older is that you've got a higher probability of making it to an even older age than a younger person has!
If an engine makes it to an "equivalent human age" of 70 years old which corresponds to 275K miles old then the engine has 15 years of remaining human equivalent life expectancy which corresponds to 105K additional miles for a total of 380K miles at an "equivalent human age" of 85 ...of course there's only a 50% probability that the engine will actually make it to 380K miles!
This leaves the lime green curve which is read on the right hand scale ...and this curve explains why people start paying closer attention to the obituaries at the age of 70 ...because 10% of their contemporaries die between the ages of 70 to 75 ...and another 13% die between the ages of 75 to 80 ...and another 16% die between the ages of 80 to 85 ...and yet another 16% die between the ages of 85 to 90 ...and then only an additional 12% die between the ages of 90 to 95 ...and this reduces to only an additional 6% dying between the ages of 95 to 100 ...because if you're still alive to read the obituaries at the age of 95 you're in a select group of only 8% remaining to do so ...and that means there just aren't very many people left to die!
If there were an obituary column for 7.3L Power Stroke engines it would read just like the above example for humans except the age at death would be the equivalent mileage shown on the graph!
#3
01-19-2010, 01:14 PM
Hotshot
#5
01-19-2010, 01:29 PM
Ernest,
You're the same age as my Dad. Class of 1960 for him too.
I have to ask, if our 7.3l's consumes alternatives fuels(aka drinks), smokes, and chase things just like a human can consume alcohol, smoke and chase things, what would be a common denominator if that "being" didn't live as long as others.
DNA(build)
Lifestyle(use)
Maintenance (self explanatory)
???( many variables)
This is awesome reading. I am very intrigued by your analysis.
__________________
Jody & Diane Tipton- DP-Tuner�
FTE Legacy Sponsors since 2006
Custom tuning for 7.3l, 6.0l, 6.4l,6.7l, Ecoboost,
Get Tuned! 828-221-0076 ext. 802
Become our Facebook Fan
Jody & Diane Tipton- DP-Tuner�
FTE Legacy Sponsors since 2006
Custom tuning for 7.3l, 6.0l, 6.4l,6.7l, Ecoboost,
Get Tuned! 828-221-0076 ext. 802
Become our Facebook Fan
#6
01-19-2010, 01:40 PM
Join Date: Jun 2006
Location: Fulltime RVer
Posts: 2,647
Likes: 0
Received 0 Likes
on
0 Posts
But then I'm a towing guy ...so my analysis isn't geared to stop-and-go inner-city driving ...but from the reports I've seen on TV lately an "inner-city" lifestyle will probably result in your truck being stolen or truck-jacked long before is wears out!
#7
01-19-2010, 03:17 PM
Cargo Master

Trending Topics
#8
01-19-2010, 04:30 PM
Hotshot
#9
01-19-2010, 04:53 PM
Duct Tape Tech.
Join Date: Jul 2009
Location: San Antonio Tx.
Posts: 2,381
Likes: 0
Received 0 Likes
on
0 Posts
#10
01-19-2010, 06:33 PM
#11
01-19-2010, 06:51 PM
Elder User
Join Date: Jun 2009
Location: Easley, SC 29640
Posts: 999
Likes: 0
Received 0 Likes
on
0 Posts
x2....LMAO...it's a good read, but, i have to ask...is this some kind of a back to school effort...

and if not, dangit, you've screwed it up for any youngun that wanted to do this report as an assignment...they can never turn in their data for risk of plegerism.....muhahaha...

#12
01-19-2010, 07:05 PM
I wondered when we were going to see this thread. Seems like I remember the advertisements several weeks ago. 
As always, your thread is an interesting read. My question has to do with the International BXX life. Since the T444e was designed as a medium duty truck engine, do you know if the design life factored in the typical use for the truck or was just stuck on an hour meter in a lab?
A bobtail application for the T444e would likely lead an abused lifestyle making frequent starts and stops while being loaded, and lots of idling time mixed in. If this type of condition is how they came up with the B50 life, then that's probably good news.
I guess this makes my truck around 75.

#14
01-20-2010, 06:49 AM
Death is a fate all humans have to endure. Machines do not. We are classifying death in the trucks from total engine failure? Well time, effort and money can fix that. If our machines die, it is because we choose to let it happen. As the truck wears you can replace parts, if the Frame rust, fix it, motor blows, fix it, body needs paint, paint it. I go to car shows and steam shows and I am amazed by what I see every time..
Death in our machines is by our choosing, economic decision, knowledge, and effort. It is our decision to assign fate to on our machines.
If you mod up. If you beat on the machine. Drive it in salt. Plow snow, Work it everyday. It will only cost more money to make it out last humans.
.
Death in our machines is by our choosing, economic decision, knowledge, and effort. It is our decision to assign fate to on our machines.
If you mod up. If you beat on the machine. Drive it in salt. Plow snow, Work it everyday. It will only cost more money to make it out last humans.
.
#15
01-20-2010, 03:06 PM
Join Date: Jun 2006
Location: Fulltime RVer
Posts: 2,647
Likes: 0
Received 0 Likes
on
0 Posts
Well so far your claim about "humans" hasn't been confirmed by actual "experimental observation" ...because more than half of all the humans who have been born since time began are still alive today ...and who knows what medical advances await us in the future?
Unlike "machines" humans have unique mechanisms for repairing the "wear and tear" damage to their DNA and research suggests that if these repair mechanisms can be enhanced and maintained by interventions such as low-calorie diets, pharmaceuticals, stem cells, etc... then life might be maintained indefinitely! Below is a link to one of the several newsletters I receive on this subject...
..."The Longevity Meme Newsletter is a weekly e-mail containing news, opinions, and happenings for people interested in healthy life extension: making use of diet, lifestyle choices, technology, and proven medical advances to live healthy, longer lives. To subscribe or unsubscribe from the Longevity Meme Newsletter, please visit... Longevity Meme Newsletter "...
If you do some research on "engine wear" you're sure to come across this word... "tribology" ...the science of the mechanisms of friction, lubrication, and wear of interacting surfaces that are in relative motion ...and "tribology" explains why "machines" will eventually wear out and die.
Even if nothing else kills a diesel engine beforehand... "tribology" ...will eventually cause enough wear of the cylinder wall, piston skirt, and piston rings so that the "heat of compression" produced during the compression stroke will be insufficient for "auto-ignition" of the fuel ...and analyzing when this "fatal wear out point" develops by calculating a "minimum required" compression test pressure reading will be one of the approaches I use to define when "engine death" occurs!
This is a "rhetorical question" ...but if one of my threads lacked some "controversy" ...would the thread really exist? ...so here comes some "controversy"! The 7.3L Power Stroke doesn't have the human equivalent of DNA repair mechanisms so the best approach for countering the effects of "tribology" is to adopt the "healthy lifestyle" of clean air, clean oil, and clean fuel!
Power Stroke engines pump "unfiltered" oil directly from the sump to the high-pressure oil pump and then on to the HEUI injectors ...and this means that not changing the "oil" and the "oil filter" at the "mileage intervals" recommended by "Ford" for the "type of service" the engine is subjected to ...or doing anything else that contributes to an accumulation of "dirt particles" in the "engine oil" ...such as sucking additional "dirt particles" into the engine by using an "inferior" third party "air filter" ...will subject the injectors to "extra wear" and "potential damage" as the "dirt particles" suspended in the oil get forced through the injectors.
Since the stock FL-1995 "oil filter" allows some particles smaller than 20 microns to accumulate in the oil ...and since particles less than 20 microns are responsible for most of the wear on the HEUI injectors ...and on the cylinder wall, piston skirt, and piston rings, and on the rest of the engine's components as well ...the best way to extend the life of an engine is to change the "oil" and the "oil filter" on a frequent basis ...and this is why "extend oil drains" based on "oil analysis" ...which seem to be so popular on this forum ...are "bad news" for engine life!
I won't even use a "10-ft pole" to further touch my comment about an "inferior" third party "air filter" ...but I will give this quote from my thread... "Air filters and oil filters... how well do they filter?" ..."The oil filter equivalent of an AIS air filter is the Fleetguard LF-3974 (Stratapore) filter which I switched to soon after it was introduced because it provides a higher filtration efficiency of small particles less than 20 microns but still has the same flow restriction of a stock FL-1995."...
I'm pretty sure that for a stock Power Stroke engine ...if every extra $ being spent on "oil analysis" and "synthetic oils" was instead used for more frequent changes of "dino oil" and "oil filters" the engine would live longer! I've already done a post on why the coolant heater should be plugged in for an hour before starting on even mildly cool nights to reduce the effects of "tribology" ...and I still can't find the reference I talked about there where each cold start causes more wear than X miles of highway driving!
The lower sections of the HEUI injectors are lubricated by the fuel ...so dirty fuel also causes injector wear ...and it's definitely worth while to upgrade the stock fuel filter by adding a 2 micron filter on the high pressure side of the fuel pump ...and due to restriction constraints a 30 micron filter is about the finest rating that should be used on the suction side of the pump. I also think a double dose of a quality fuel additive in every tank of fuel is a good practice!
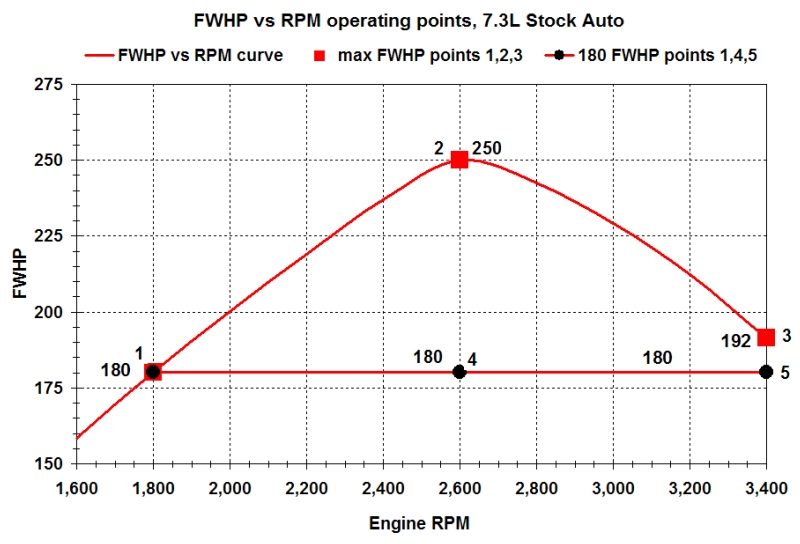
Below is a referenced picture and a list of numbered components that might break, wear, fail, clog, or leak ...to the point that major work is required to get or keep an engine running ...and in a future installment I'll start by addressing... #1..Pistons, rings, and cylinder bores ...by calculating the cylinder-pressure induced loads on the piston, the inertial loads, and the thermal loads ...at each of the 5 operating points indicated on the FWHP vs RPM graph I gave previously ...so stay tuned!
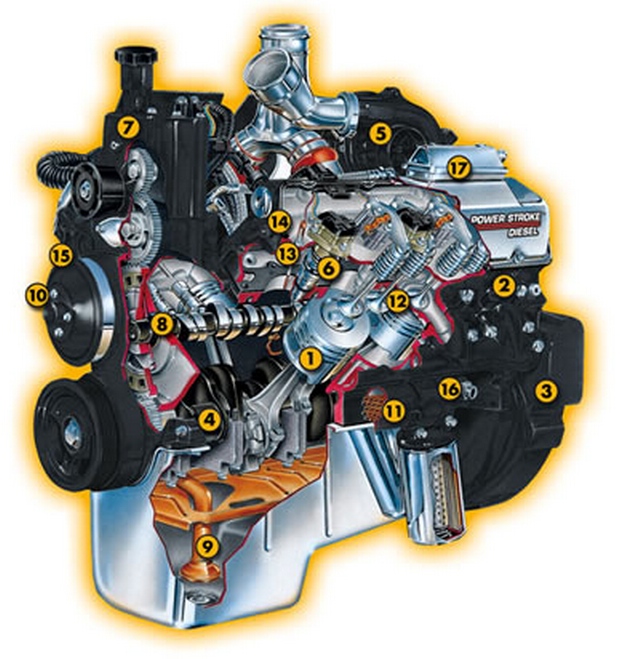
..1..Pistons, rings, and cylinder bores
..2..Combustion chambers and cylinder heads
..3..Crankcase, gaskets and rust
..4..Crankshaft, rods, and bearings
..5..Turbocharger
..6..Injectors
..7..High pressure oil pump
..8..Camshaft lobes and lifters
..9..Oil pump
10..Water pump
11..Lube oil cooler
12..Valves and valve guide inserts
13..Glow plugs
14..Valve cover gaskets
15..Thermostat
16..Coolant heater
17..Crankcase breather
18..Electronics, wiring, connectors, etc...
Unlike "machines" humans have unique mechanisms for repairing the "wear and tear" damage to their DNA and research suggests that if these repair mechanisms can be enhanced and maintained by interventions such as low-calorie diets, pharmaceuticals, stem cells, etc... then life might be maintained indefinitely! Below is a link to one of the several newsletters I receive on this subject...
..."The Longevity Meme Newsletter is a weekly e-mail containing news, opinions, and happenings for people interested in healthy life extension: making use of diet, lifestyle choices, technology, and proven medical advances to live healthy, longer lives. To subscribe or unsubscribe from the Longevity Meme Newsletter, please visit... Longevity Meme Newsletter "...
If you do some research on "engine wear" you're sure to come across this word... "tribology" ...the science of the mechanisms of friction, lubrication, and wear of interacting surfaces that are in relative motion ...and "tribology" explains why "machines" will eventually wear out and die.
Even if nothing else kills a diesel engine beforehand... "tribology" ...will eventually cause enough wear of the cylinder wall, piston skirt, and piston rings so that the "heat of compression" produced during the compression stroke will be insufficient for "auto-ignition" of the fuel ...and analyzing when this "fatal wear out point" develops by calculating a "minimum required" compression test pressure reading will be one of the approaches I use to define when "engine death" occurs!
This is a "rhetorical question" ...but if one of my threads lacked some "controversy" ...would the thread really exist? ...so here comes some "controversy"! The 7.3L Power Stroke doesn't have the human equivalent of DNA repair mechanisms so the best approach for countering the effects of "tribology" is to adopt the "healthy lifestyle" of clean air, clean oil, and clean fuel!
Power Stroke engines pump "unfiltered" oil directly from the sump to the high-pressure oil pump and then on to the HEUI injectors ...and this means that not changing the "oil" and the "oil filter" at the "mileage intervals" recommended by "Ford" for the "type of service" the engine is subjected to ...or doing anything else that contributes to an accumulation of "dirt particles" in the "engine oil" ...such as sucking additional "dirt particles" into the engine by using an "inferior" third party "air filter" ...will subject the injectors to "extra wear" and "potential damage" as the "dirt particles" suspended in the oil get forced through the injectors.
Since the stock FL-1995 "oil filter" allows some particles smaller than 20 microns to accumulate in the oil ...and since particles less than 20 microns are responsible for most of the wear on the HEUI injectors ...and on the cylinder wall, piston skirt, and piston rings, and on the rest of the engine's components as well ...the best way to extend the life of an engine is to change the "oil" and the "oil filter" on a frequent basis ...and this is why "extend oil drains" based on "oil analysis" ...which seem to be so popular on this forum ...are "bad news" for engine life!
I won't even use a "10-ft pole" to further touch my comment about an "inferior" third party "air filter" ...but I will give this quote from my thread... "Air filters and oil filters... how well do they filter?" ..."The oil filter equivalent of an AIS air filter is the Fleetguard LF-3974 (Stratapore) filter which I switched to soon after it was introduced because it provides a higher filtration efficiency of small particles less than 20 microns but still has the same flow restriction of a stock FL-1995."...
I'm pretty sure that for a stock Power Stroke engine ...if every extra $ being spent on "oil analysis" and "synthetic oils" was instead used for more frequent changes of "dino oil" and "oil filters" the engine would live longer! I've already done a post on why the coolant heater should be plugged in for an hour before starting on even mildly cool nights to reduce the effects of "tribology" ...and I still can't find the reference I talked about there where each cold start causes more wear than X miles of highway driving!
The lower sections of the HEUI injectors are lubricated by the fuel ...so dirty fuel also causes injector wear ...and it's definitely worth while to upgrade the stock fuel filter by adding a 2 micron filter on the high pressure side of the fuel pump ...and due to restriction constraints a 30 micron filter is about the finest rating that should be used on the suction side of the pump. I also think a double dose of a quality fuel additive in every tank of fuel is a good practice!
Below is a referenced picture and a list of numbered components that might break, wear, fail, clog, or leak ...to the point that major work is required to get or keep an engine running ...and in a future installment I'll start by addressing... #1..Pistons, rings, and cylinder bores ...by calculating the cylinder-pressure induced loads on the piston, the inertial loads, and the thermal loads ...at each of the 5 operating points indicated on the FWHP vs RPM graph I gave previously ...so stay tuned!
..1..Pistons, rings, and cylinder bores
..2..Combustion chambers and cylinder heads
..3..Crankcase, gaskets and rust
..4..Crankshaft, rods, and bearings
..5..Turbocharger
..6..Injectors
..7..High pressure oil pump
..8..Camshaft lobes and lifters
..9..Oil pump
10..Water pump
11..Lube oil cooler
12..Valves and valve guide inserts
13..Glow plugs
14..Valve cover gaskets
15..Thermostat
16..Coolant heater
17..Crankcase breather
18..Electronics, wiring, connectors, etc...