
Does this AE graph look normal?
#1
 04-08-2011, 10:42 PM

Join Date: Dec 2009
Location: Fort Campbell, KY
Posts: 864
Likes: 0
Received 0 Likes
on
0 Posts
Does this AE graph look normal?
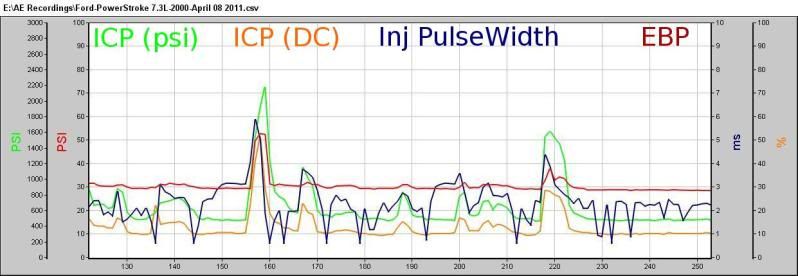
The two spikes in this graph are 1st, pulling out from dead stop WOT until ~65mph, 2nd was a steep grade, 1/8mi long, pulled it in second gear.
I didn't have a load available to test with, so I though starting in second would be a pretty good load up that hill.
Seems to me the INJ pulse width is all over the place
I didn't have a load available to test with, so I though starting in second would be a pretty good load up that hill.
Seems to me the INJ pulse width is all over the place
#3
04-09-2011, 10:46 AM

Based on the fact that you say it was a WOT run, I see your ICP is low as is your DC. The majority of your data shows your ICP at 600-1000 PSI of ICP which is idle or just over idle. Not consistent with a WOT run. Duty Cycle also verifies that it is at idle or close to idle. IJ. PW. is all over the place, but really only jumps from 1-6 m/s. What were you doing during this time?
#4
04-09-2011, 08:53 PM
Join Date: Dec 2009
Location: Fort Campbell, KY
Posts: 864
Likes: 0
Received 0 Likes
on
0 Posts
Based on the fact that you say it was a WOT run, I see your ICP is low as is your DC. The majority of your data shows your ICP at 600-1000 PSI of ICP which is idle or just over idle. Not consistent with a WOT run. Duty Cycle also verifies that it is at idle or close to idle. IJ. PW. is all over the place, but really only jumps from 1-6 m/s. What were you doing during this time?
 I thought it was recording while I was driving, but maybe not. This picture was the graph after it played so it kinda bunched it all up.
If there was anything good I did get while running the AE last night, all my injectors were at 0.0% for the rotational velocity.
 What should I be checking?

